QUESTION: Marty, I have followed your Global Market Watch and it is really amazing. I noticed on IPE gas it came up and warned it was about to breakout to the upside. You said this is purely a pattern recognition system. Are there patterns that precede events and this is what your model is picking up on?
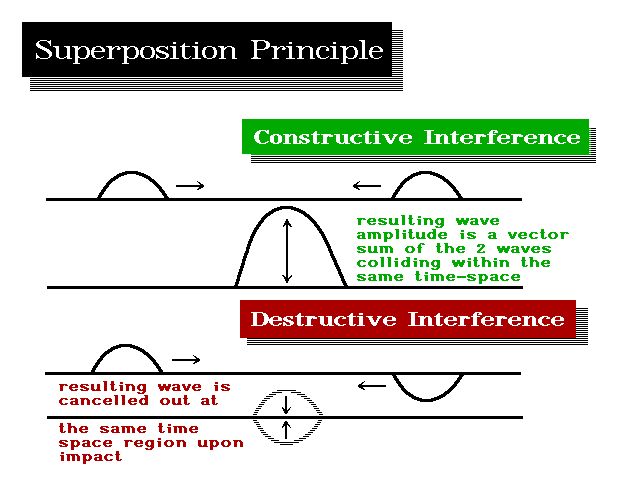
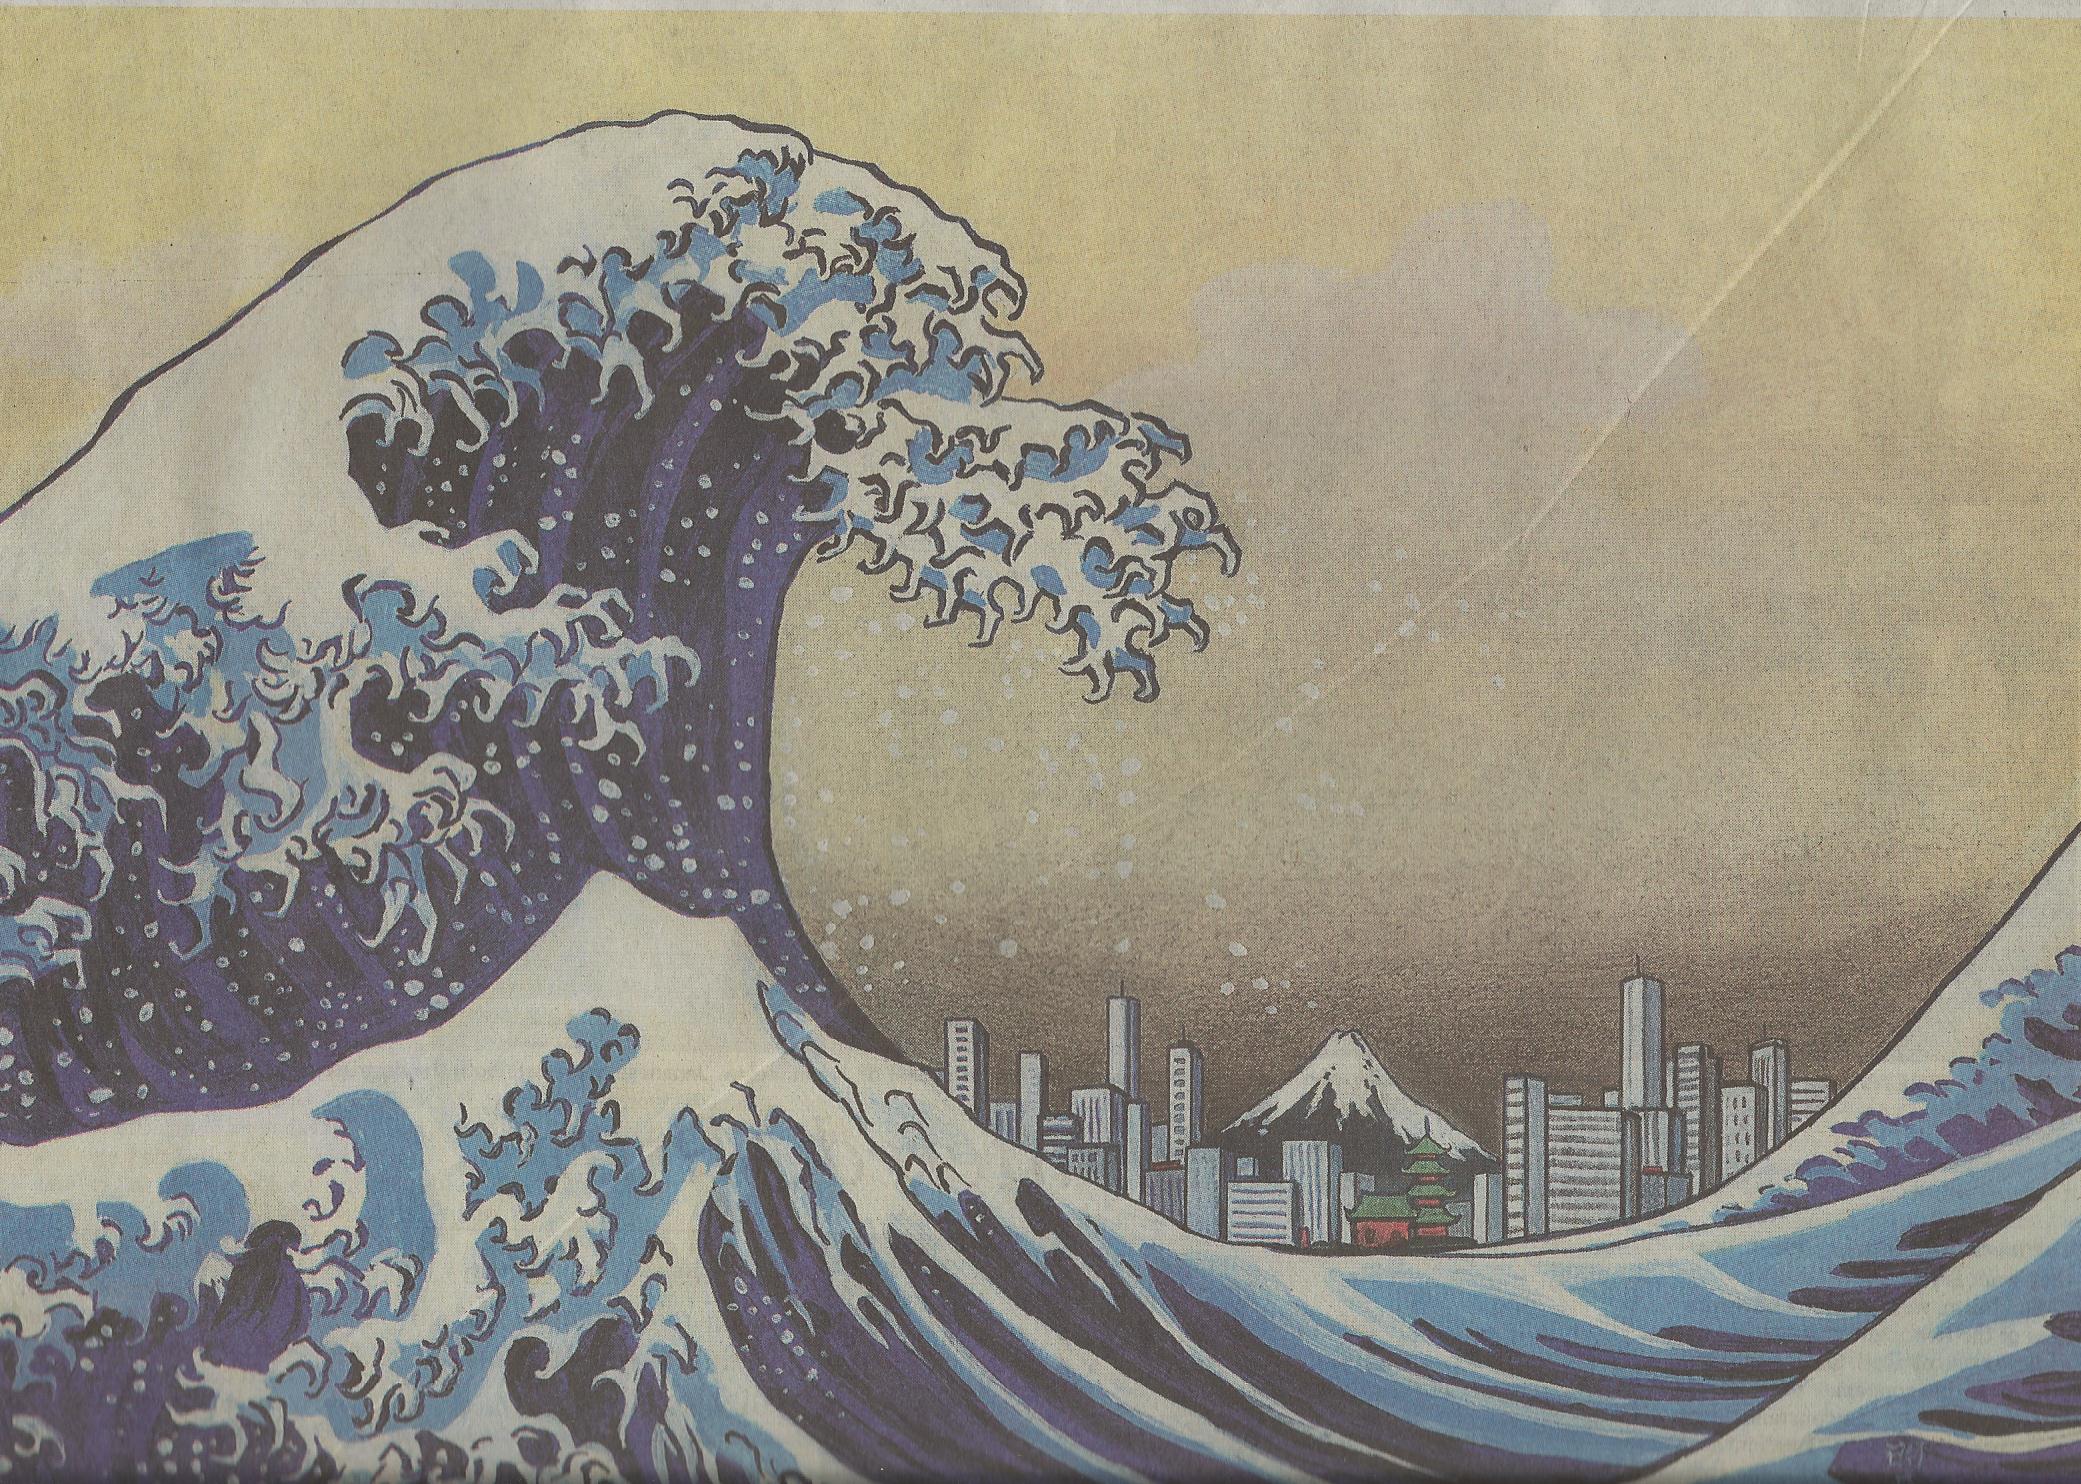 ANSWER: In many fields there are these sudden Phase Transitions on the upside and Waterfall collapses on the downside which are extreme events. I have explained that sailors always told of rogue waves that rise up from calm waters and sink ships. The rogue wave appears out of nowhere in the eternal sea of global economics just as it does the oceans of the world. They are caused by the synchronization of many trends suddenly coming together to produce a giant wave.
There is an instability inside a gas turbine that suddenly appears, or a sudden extinction of previous ecosystems – mass extinctions of which there have been five so far with another one due probably at the end of the next 309.6 year cycle in the 2300-2400 time period.

In 1995, there was the first measurement of such a Rogue Wave known as the Draupner Wave or New Year’s wave. It struck the Draupner oil platform in the North Sea off the coast of Norway on January 1st, 1995. This provided the first opportunity to actually measure such a wave carried out by Engineer Paul Taylor. The platform survived this event, but the wave, measured with lasers, was 84 feet high (25.6 meters) in a sea where the average wave was 39 feet high (12 meters). This was the first measurement of a Rogue Wave ever accomplished to verify what sailors have told about for thousands of years.
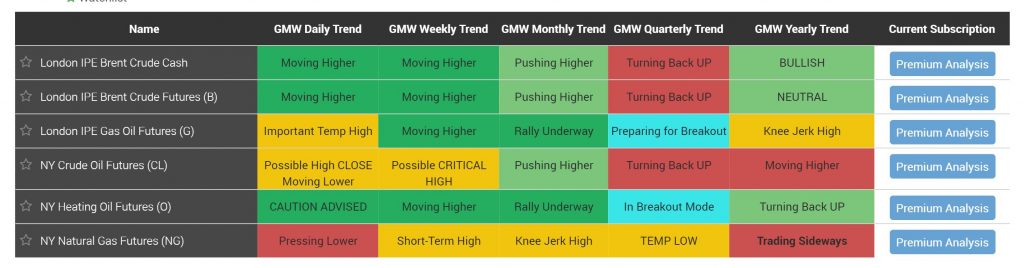
These extreme Phase Transitions and Waterfalls or extreme events occur without warning to the untrained eye. It’s often impossible to predict when such bursts of instability will strike in markets where there are a huge amount of variables from news to players from a human perspective. The GMW identifies key patterns that precede an extreme event and when it seeing such a pattern it will highlight it is cyan (light pale blue).
This framework is being applied to all markets and economies and allows us to see things through complexity that the human eye will never see. This is far beyond human analysis. There are now over 100,000 patterns its has recorded.

