Understanding the Markets
QUESTION: Mr. Armstrong; On your January 29 blog, you wrote “In the US Share Market, this is now a turning point we have reached. I have warned for months that exceeding the November high would lead to a January high. Now, the failure of February to make new highs warns of a March low. The support for a correction now lies at the 25637 level on a weekly closing basis (this is not a reversal). We will elaborate today on the Private Blog.” You warned that March could produce a high and keep the cycle inversion process in play. That proved correct since the Nasdaq made new highs and the Dow a reaction high. So that led to the drop into the first week of April. For the actual buy and sell signals, we should only do so on reversals and turning points. The January high you did with the turning point I assume and then the reversals kicked in. The buying opportunity I also assume we must wait for the turning point as was the case for the high. Correct?
PF
ANSWER: Correct. I have made it perfectly clear that NORMALLY one turning point is followed by the OPPOSITE event on the next. So a January high would traditionally produce a March low. However, I pointed out that we have been in a Cycle Inversion. September 2017, November 2017, and January 2018 followed by March 2018 were all the monthly sequential turning points. Normally, each would produce the opposite. That was not the case and each produced a high. This is the Cycle Inversion and it is also warning that we are still consolidating. March produced a high in the Nasdaq and only a reaction high in the Dow. This further warned that there was a shift from an international focus to domestic (Dow v Nasdaq). March also produced only a reactionary high the week of 03/12.
Far too many people expect a guru and want to act based solely upon a comment. Buy this or sell that and that person should always be correct. That is the dream of a fool for nobody can do that. They will ALWAYS quickly lose their money and then blame their pretend guru. That is a sure-fire way to go broke and if they are trying to trade short-term on such comments, they must be insane.
I have stated at the outset of this year that 2018 was a Panic Cycle. That means you test both directions! I further warned that we would see consolidation dominate the first part of 2018 so there was no reason to rush back in until we reach (1) turning point and (2) reversals. The closing of the first quarter was neutral in many markets once again showing that we are still in this consolidation mode. Buy or sell signals are on REVERSALS – never comments.
If you are trying to be a short-term trader and you think that will lower your risk, you are dead wrong. The best performance is to go with the trend and act ONLY on Weekly to Monthly signals – not commentary. January was a critical turning point. All our models were converging at that time so it was ripe for the correction which is why I stated that and was already getting criticism by January 31st, 2018.
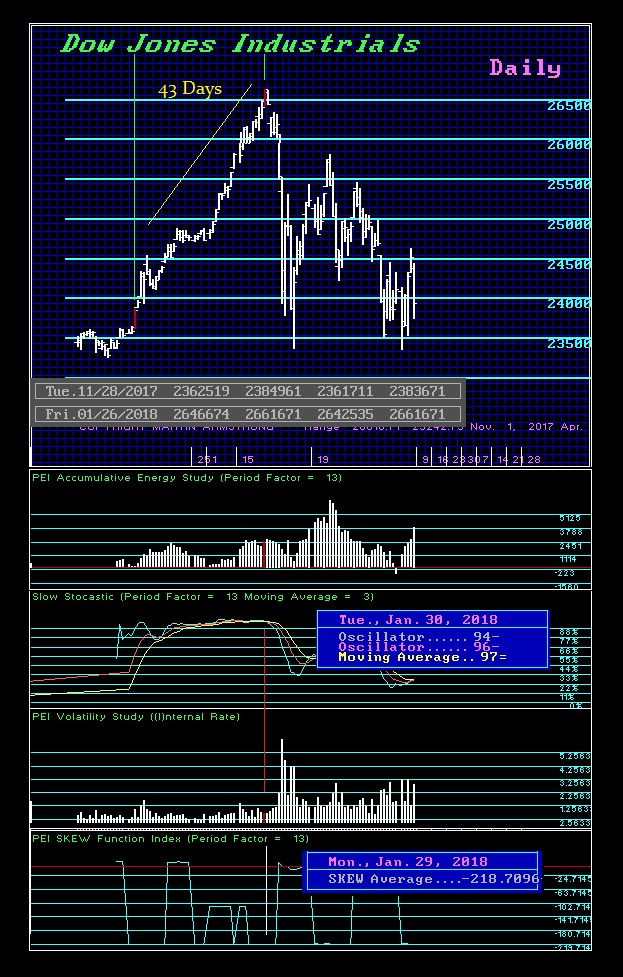
The high was Friday January 26th. Every model we had was starting to scream DOWN! The Cycle Inversion was confirmed on the first day of December. I warned if we exceeded the November high, we would rally into January. The high came exactly 43 days (8.6 /2) from the breakout. That frequency does NOT work in the share market except at extreme turning points. That lined up perfectly. The oscillators, always a lagging indicator, turned down on the 30th. Our Skew Model bottomed one day from the high on the 29th. Our Energy Model peaked on the very day. The subsequent sharp rally into March confirmed this was a reaction high when energy was making new highs but the price was not. The key is always the divergence!
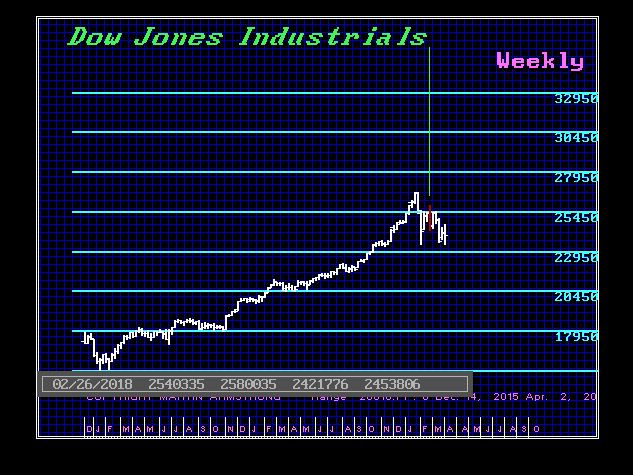
Here is the Array on the Dow from February. There were three weeks targeted 02/12, 02/26, and 03/12 followed by 04/02. The week of 02/12 was a Directional Change and that sent the market back up leaving the February low intact. The next target was 02/26 which produced the reaction high in the Dow. The next target 03/12 produced the high in the Nasdaq. Then the next target 04/02 produced the retest of the Feb low. Once again, we can see how the markets were interacting and producing the shift from international to domestic.
Clearly, the commentary is just an attempt to explain what is unfolding. It is NEVER for trading purposes. We trade based upon the Reversals and Timing exclusively. With the Array, Energy Models, and Reversals, you can easily see how the market is performing. This is essential to providing the underlying CONFIDENCE to trade. Just those three indicators in combination will help to keep you one the right side of events.


