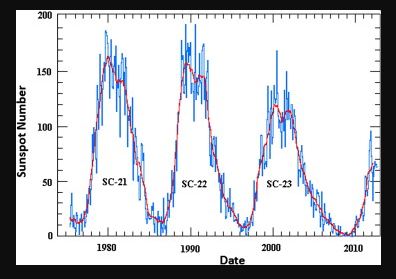
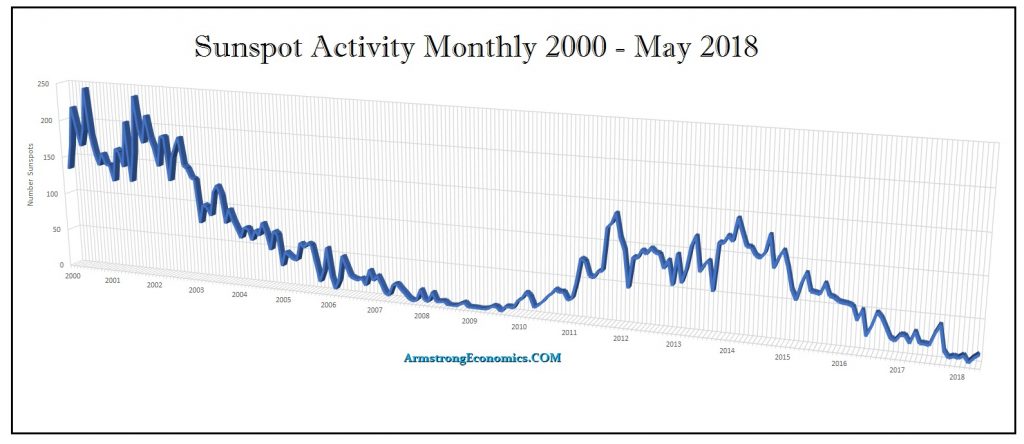
The deep minimum of Solar Cycle 23 and its potential impact on climate change has been interesting. In addition, a source region of the solar winds at solar activity minimum, especially in the Solar Cycle 23, the deepest during the last 500 years, has been studied. Solar activities have had a notable effect on palaeoclimatic changes. Contemporary solar activity is so weak and hence expected to cause global cooling. The Solar Cycle 23 began during April 1996 and had its peak in early 2000/2001. The decline phase thereafter extended from 2002 until December 2009. That was the longest decline phase of any of the previous 23 solar cycles. The overall length of solar cycle 23 extended for a period of 13.5 years from April 1996. As shown on this chart, notice that each cycle has been declining in intensity. Solar Cycle 23 was sharply weaker and what has come in Solar Cycle 24 is even weaker still.
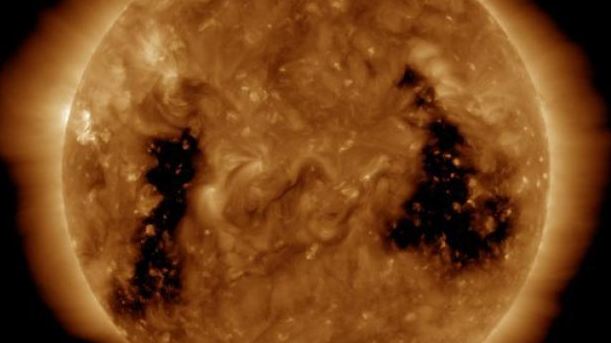
This solar cycle minimum seems to have unusual properties that appear to be related to weak solar polar magnetic fields. The immediate Solar Cycle 24 began during 2009. It was a late starter given the extension of Solar Cycle 23 which interesting was a Pi Cycle extension of 3.14 years. This is true looking at the previous cycles of the 20th and 19th centuries warning that something is indeed unfolding here that is unusual. There are small polar coronal holes appearing which add to the complexity of coronal morphology. Coronal holes are most prevalent and stable at the solar north and south poles, however, these polar holes can grow and expand to lower solar latitudes. It is also possible for coronal holes to develop in isolation from the polar holes, or for an extension of a polar hole to split off and become an isolated structure.
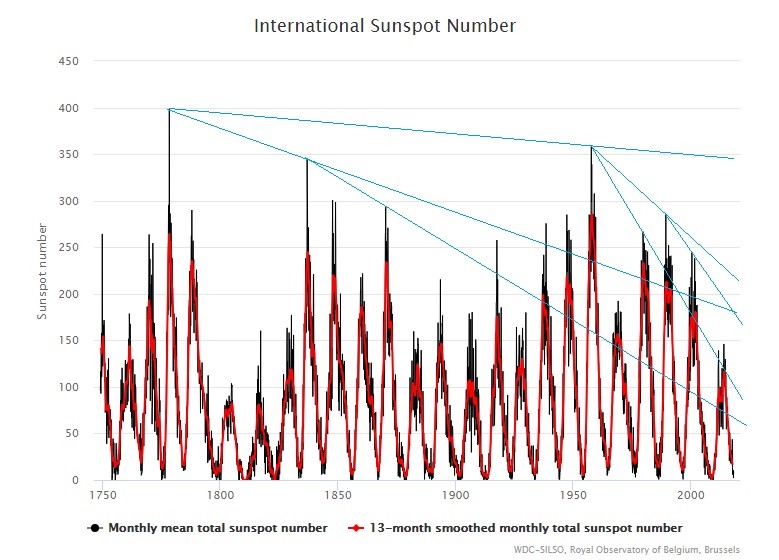
We must pay attention to the fact that this magnetic configuration at the Sun is incredibly different from the one observed during the previous two solar minima periods. Magnetic activity during the years 2006–2009 has been very weak with sunspot numbers reaching the lowest values in about 100 years. This long and extended minimum is characterized by weak polar magnetic fields. We can see that we have been in an extended decline since the 18th century. This rather disturbing when we run correlations with this on the economic trends.
Earth’s atmosphere varies opposite to the solar activity since the cosmic ray particles are deflected by the Sun’s magnetic field to a greater or lesser degree. With increased solar activity (and stronger magnetic fields), the cosmic ray intensity decreases, and with it the amount of cloud coverage, resulting in a rise of temperatures on Earth. Conversely, a reduction in solar activity produces lower temperatures.
Current Solar Cycle 24 has been declining much faster than expected. There is some concern that Solar Cycle 24 might possibly extend as well for the weather has been getting excessively colder in the northern regions. The peak in the cycle arrived during April 2014 reaching an average sunspot number of 82. While the peak value was within the expected range of error for the general forecasts, the maximum occurred significantly lower than the forecasts.
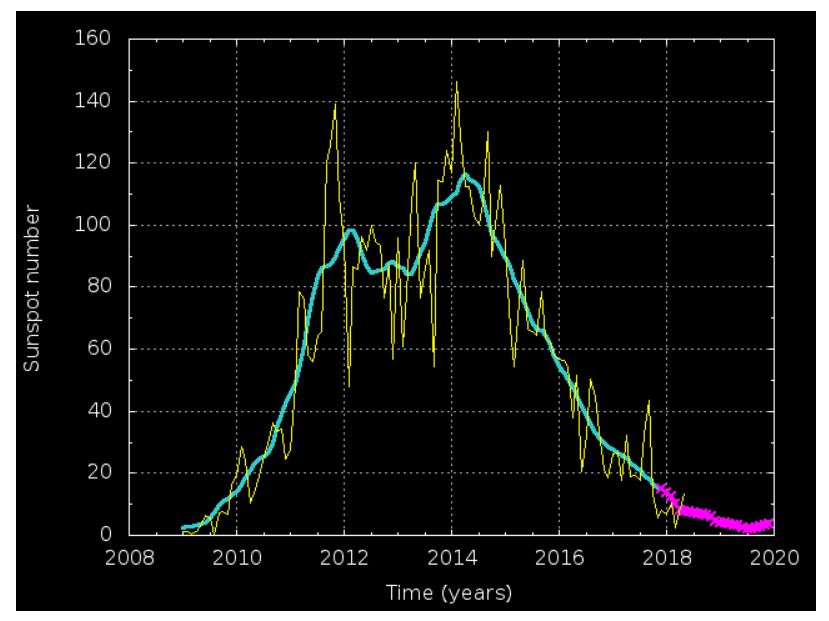
This is the current forecast for Solar Cycle 24. We can see the pink project is the forecast of the industry and it coincides very well with our Economic Confidence Model. I have stated before that I attended a presentation of the data collected from the ice core samples. It revealed a 300-year major cycle in the energy output of the sun. It matched the Economic Confidence Model I constructed from entirely different source data including the monetary history of human activity. I was stunned, for it demonstrated to me that the rise and fall of empires, nations, and city-states was also in part instigated by climate change. When it turns cold, this is when civilization contracts. The bottom of this immediate ECM is January 2020. The forecast for Solar Cycle 24 will bottom around that same time period.
We are running our models on all the data to come up with our own forecast for Solar Cycle 25, which will take us into the end of this 51.6-year Wave in 2032 and the culmination of the 309.6-year cycle in the ECM. As you can see, Solar Cycle 24 is significantly lower than the Solar Cycle 23. You can see why I moved to Florida. Preliminary findings show that each wave is progressively getting weaker and that may be in line with what we expect in commodity prices as well as what is to come after 2032.

