Reviewing The Dow Arrays

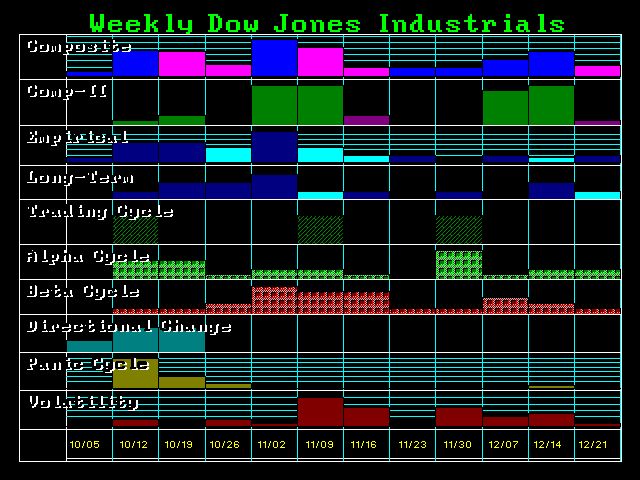
COMMENT: Mr Armstrong, I have been the ultimate skeptic for so many claimed analysts give an opinion and that is really it. I have kept track of your arrays on the weekly Dow. I understand why the government wanted your model. Your model really works. Your array posted last October 16 picked the November high amazingly. The market collapsed for the next 11 weeks.

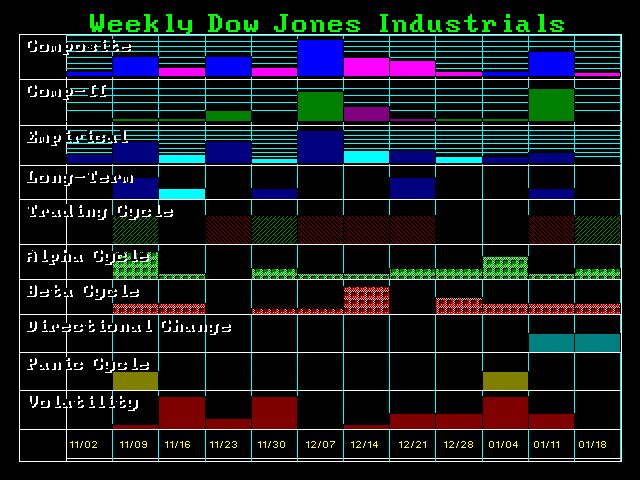
The next array you published on November 15, showed the main targets as the weeks of December 7 and January 11. The week of January 11 was the lowest closing and the next week of January 18 produced the lowest low intraday.

On February 14, you published an array showing the week of February 22 followed by the weeks of March 7 and 21 would be turning points.

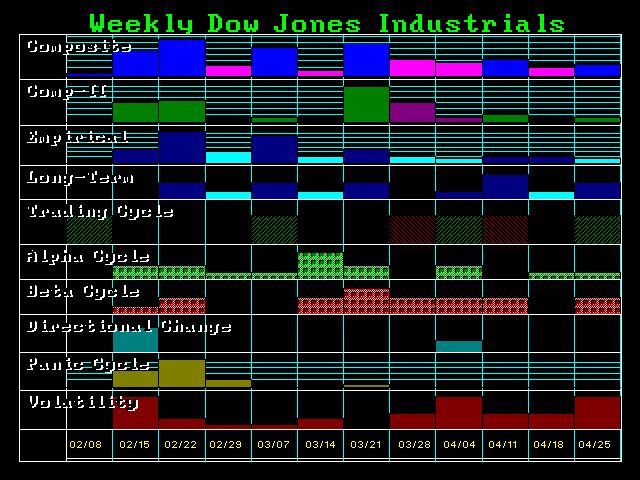
Then on March 11 you published an array showing the weeks of March 28, April 11 and beyond that were April 25 and May 16.

About a week later on Mach 18, you published another array which showed the week of April 11th grew stronger.

On April 1, you then published an array showing the week of April 25, which suddenly became a stronger target than the week of April 11. I assume as you move closer more hits begin to form. The target dates seem to remain constant but the intensity changes.

Then on April 6, the target week of April 25 becomes major. In the distance, the week of May 30 starts to appear. You also said that the top row in the array provides the main turning points marked by the highest and the lowest bars. This meant the two lowest bars are April 18 and May 23. So it is curious how the intraday high comes between the two big bars.

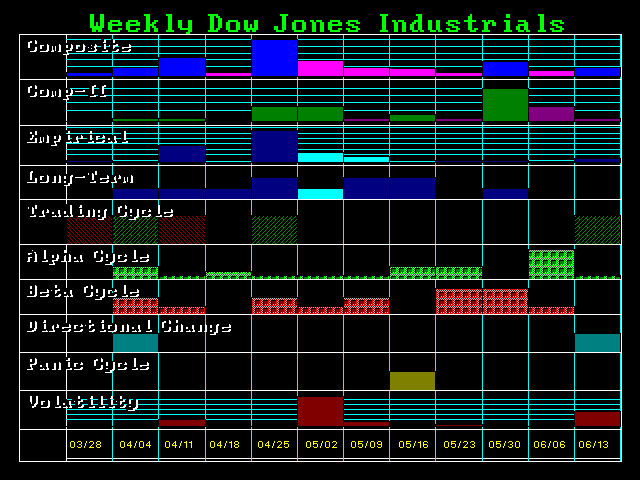
On April 13, you then published the next array showed still the April 18 lowest bar and a huge jump in the week of May 9 over and above the week of April 25. This did not appear as a target in the previous array at all. Then the week of May 16 showed up as a Panic cycle since the March 11 array. Last week made a new low but then closed above your weekly reversal at 17434 perhaps meaning that is the low. The week of the 9th was a reaction high exceeding the high of the previous week.

On May 6 you posted the next array, which showed the week of May 9 shifting to the 16, and suddenly the week of May 30 jumps up. This target at least began to appear weeks before. The week of the 16 turns into a Directional Change and the panic move off to June 6. Now it appears as we go into the BREXIT vote, volatility will rise and you have three Directional Changes in a row.
I think I am getting the hang of these arrays. It will be very helpful for the computer to explain this as it is going forward. Just a suggestion.
Thank you
REPLY: It looks like you did a good job on your interpretation. If the market is moving in wide swings, it may impact the targets moving forward. Keep in mind that the top bar is not forecasting on a static basis. The plotting will be to scale for each array. So the biggest bar is just the biggest within that scope. So let’s say 5/30 is 20 hits. That is the biggest within that 12-week time frame. Now as we move forward, let’s say 06/27 becomes 35 hits. The number of hits for the 30th does not decline. June 27 has more hits than May 30, which shows that it will have a higher bar that becomes the reference point against which to scale.
You have to keep in mind that accusing me of manipulating the world economy shows that those in government and the bankers were trying to do just that. They lost so the conclusion becomes I must have more people then them. The proposition is rather absurd. Nonetheless, this also reflects that they are not willing to accept the possibility that they cannot control the world. They blame me rather than accept the fact that perhaps there are bigger things in life than just them.
These arrays PROVE beyond a shadow of a doubt that the markets have a hidden order to them. This is why “opinion” fails and nobody can forecast from such a perspective. I can tell you that in gold, from the 2011 high the low could form as soon as a two-year decline, which would make that 2013. But, 2012 made the highest closing, so it could be measured from that making it 2014. The next would be three years, making it 2014 and 2015. Beyond that, it would be five years and that makes it 2016 or 2017. I can express my “opinion” as to which of the three potentials it might be, but it becomes the combination of time and price that confirms which one. My “opinion” when I say “I think” cannot be a forecast, only the computer can do that. Nobody’s opinion can ever be consistent.
As for the Dow, the same is true. Yes, the maximum for a reaction from the 2009 low would be three years. Even the 1929 Crash was 34 months between 1929 and 1932. Because the Dow got it over within the three-year time frame, it was off to new highs. Compare that to the Nikkei. Push beyond that three-year limit and it becomes a prolonged bear market.
So the Dow will double. That much is inevitable. The question is only time. You have the idiots who try to criticize because they have been wrong (typically in gold) so they try to say I was wrong and the Dow did not double, which somehow means I will be wrong on gold. Rather than becoming a student of markets, they prefer to cling to their vision no matter how wrong. The Dow bottomed in 2009 at 6469.95 and double that would be 12,939.9. I think we did that. Our three targets have been given countless times – 18500, 23000, and the 30000–40000. Well we reached the first level. We will breakout to the next. Then we will see about the third. Keep in mind that we have PRICE that must be met with the TIME. So we know we move to the next if we have not met the timing objective.
Yes, the computer will articulate this. We are working on the verbiage at this time.

