The New Highs in US Share Market Are they the Prelude to a Crash?
 Finally, the Dow made new highs in the face of constant calls for a crash. This past week, in a horse race we would call it a trifecta where the Dow Jones Industrials, S&P 500,and the NASDAQ all made new record highs. This sent a bunch of analysts to look again and began to proclaim that this was the first time that all three major indices have reached new highs on the same day since 1999. They then look at the charts and pronounce that the 1999 rally lasted only until 2000 and then crashed. Of course that was the DOT.COM Bubble and there was a massive wave of retail investor in the market back then compared to today.
There really is nothing similar whatsoever to this latest pronouncement. As always, people will try to reduce everything to turn upon a single reason. Here is a chart of the S&P500 and the crash of 1998, which was the Long-Term Capital Management debacle and the fall of Russian debt.
The market again peaked exactly to the day of the ECM back then. However, the crash was 58 days and then in 32 days the market rebound to the former high. Note that the there were three lows with the last and final low creating a Slingshot move, As I have warned, these type of moves are the most powerful and very necessary to propel any market to new record highs. You simply must trap the majority on the wrong side of the trend,
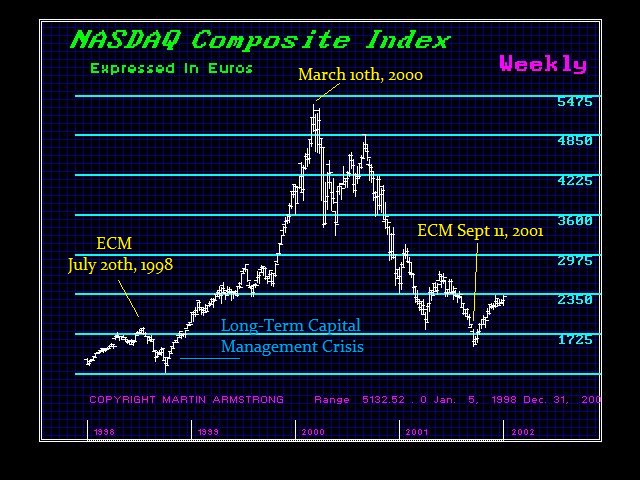
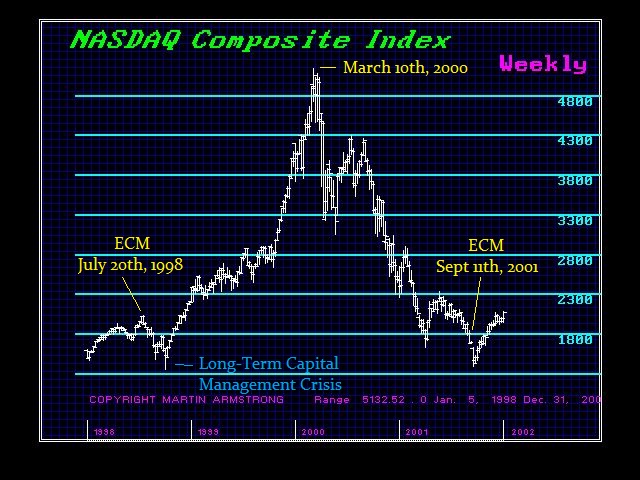
The DOT.COM Bubble was the last great capital inflow from around the world. Both Europeans and Asians were pouring money into the DOT.COM Bubble – it was by no means a local event. This move was the classic Phase Transition. However, when we look at that in terms of the Euro (which we recreated using the same formula extending back in time), we get the same Phase Transition rally
We do not see a stark difference between the patterns in dollars as we see in euros. Hence, this attracted foreign capital creating an explosive rally which we call the Phase Transition.
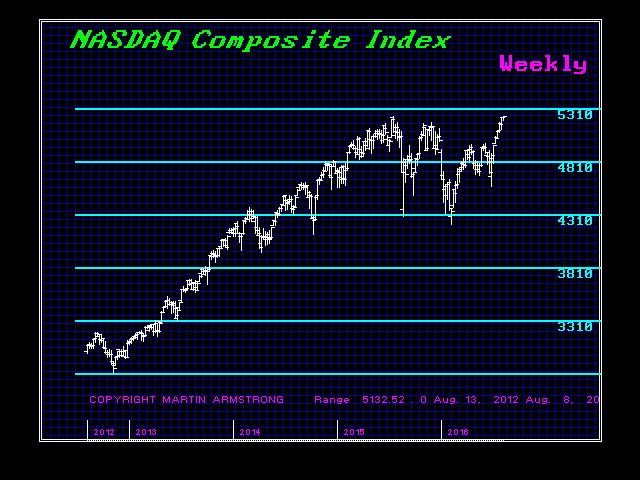
Now, when we look at the current position of the NASDAQ both in dollars and euros, we see something different. In dollars we made the new highs. However, when looking at this is euros, we do not yet see new highs being made. As always, things are not always as they seem to the local observer.
So the last magic formula going around was the 9 day consecutive decline which was supposed to lead to a crash. OOPS. Here might be another brilliant observation.


