A$ – Wheat & Wool – the Outlook
On the yearly level in Wheat CBT Futures, the last important low was established during 2010 at 4254, which was down 2 years from the high made back during 2008 at 13494. However, the highest closing was during 2007 at 8850. Right now, the market is trading below last year’s low of 4606. Overall, the market has been in a long-term bearish trend. At this time, the market is trading in a bearish position below our yearly momentum indicators warning resistance starts at 5990.
Honing in on the longer term yearly level, we see turning points where highs or lows on an intraday or closing basis should form will be, 2017, 2020, 2023 and 2025. Considering all factors, there is a possibility of a decline moving into 2017 with the opposite trend thereafter into 2020. This is a realistic potential since we have already penetrated last year’s low of 4606. The Yearly Bearish Reversal lies at 3110. Wheat has fallen to 3866 so far here in 2016. As long as 2016 holds 3110 for the year-end closing, then we should be looking a forming as early as 2017. We have already penetrated also the 2010 low of 4254.
Focusing an important timing model, the Directional Change Model target is 2017. This model often picks the high or low, but can also elect a breakout to a new higher trading zone or a breakdown to a new lower trading level.
YEARLY TECHNICAL ANALYSIS
01/01/2016… 2198 4523 5450 8460
01/01/2017… 2219 4656 4445 8510
01/01/2018… 2240 4790 3439 8560
01/01/2019… 2261 4923 2434 8610
01/01/2020… 2282 5056 1428 8660
01/01/2021… 2303 5190 423 8710
01/01/2022… 2325 5323 8760
YEARLY ANALYSIS
In the event of new intraday lows developing beyond this year, then the final low could extend into 2017. Broadly speaking, a month-end closing BELOW 3070 is where the critical support lies. Only a monthly closing BELOW 3070 will confirm a long-term bear market is in motion. Otherwise, here lies important dynamic support within this market and holding this level is a clear line of demarcation in long-term trend. Make no mistake about this key level. If it is breached on a closing basis, then a continued decline is the most likely broader outcome. However, this appears to be a remote possibility. An annual closing back above 7997 will confirm a breakout to the upside is unfolding into the years ahead. Nevertheless, we have penetrated last year’s low of 4606. A year end closing below 4606 will warn of a further decline ahead ideally into 2017.
In A$, the key monthly closing to watch lies at 4190. This is actually equivalent to the US$ number 3070. In terms of A$, wheat has also made a new low so far in 2016 reaching 5111 during August. We need a monthly closing back above 5733 to signal wheat will rise in A$ terms. The only thing to unleash that result requires the dollar to rise sharply.
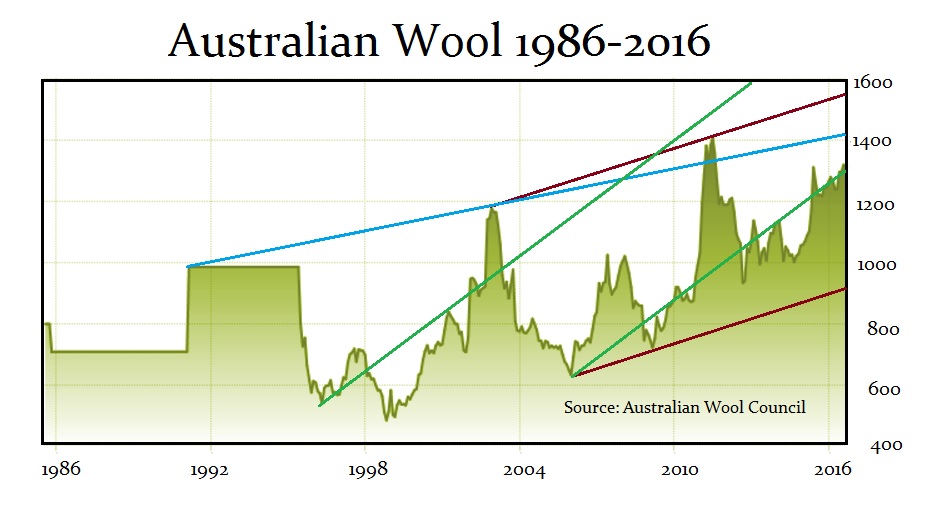
The Australian Wool market is poised to make new highs in nominal terms, but it is still nowhere near the 1951 high in real terms. The Australian wool industry peaked in 1950-51 when the average greasy wool price reached 144.2 pence per pound, (about $37 per kilogram). Today’s prices in the area of $3.20 per kilogram illustrate the stark difference. That major high in terms of wool was created by a two-prong influence. First, the British pound was devalued in 1949 from $4.86 to $2.80. The British demand for Australian wool had consumed about 50% of the annual production. The prices reached in 1950-1951 surged initially, as always, to reflect the devaluation of a currency. This was 9x the 1945-46 United Kingdom contract price, and almost 14x the average for the 10 seasons ending in 1938-39. Nonetheless, the rally in wool was also furthered by the short-lived surge in American demand created by the Korean War.
It is very clear that Australian Wool has been greatly influenced by the cycle in gold and thus mining. The low in wool coincided cyclically with gold in forming a 1999 low. The peak is also 2011 as was the case in gold. We are pushing against resistance at this point and we need to close above 1300 to maintain a bullish posture at year-end. However, unlike gold, the decline was confined to the two-year reaction phase. Therefore, wool is in a better position than gold. Breaking through the 2011 high should see the price test the high 1500s to 1600.
When we look at Wool expressed in US dollars, we can see the significant difference this makes. Overall, we do see 2017 as a potential turning point also for the wool market. Take the lead from wheat in A$ terms for now.


