Schiller Cyclically Adjusted PE Ratio (CAPE) – Real or Misleading?

QUESTION: Hi Martin,
Long time… perhaps you can reflect on the indicator of the Shiller CAPE ratio?
Not that it is a predictive sell/buy signal in itself, but it is an indicator showing history
R
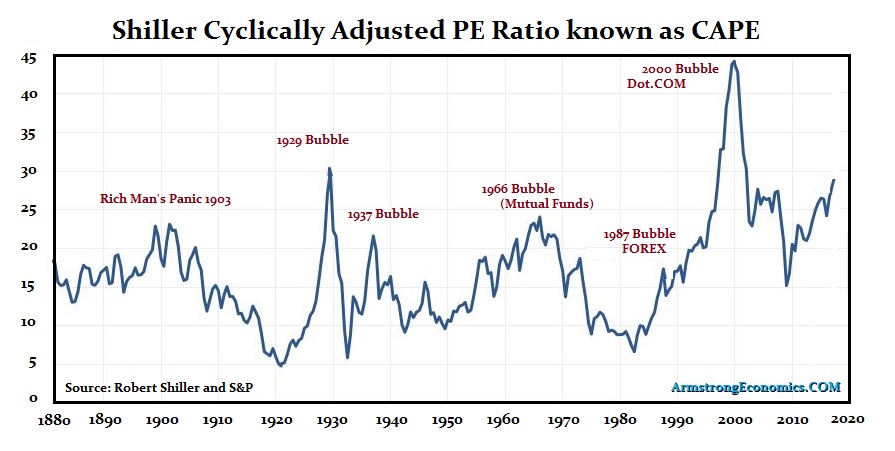
ANSWER: The Shiller Cyclically Adjusted PE Ratio known as CAPE, is a particular PE ratio invented by Robert Shiller of Yale University. Unlike his index on real estate, this one tracking the period of 1870 to date is not very good. True, you will arrive at one of two conclusions that either the CAPE today is near the same level as in 1929, or it is higher today than it was just before the Panic of 2008. Does this really mean anything? Absolutely not!
When we filter this purely domestic view through the currency and capital flows, these two events are exactly opposite of each other. In 1929, the capital inflows were pouring into the USA whereas in 2008 then were exiting. The 2000 Dot.COM Bubble took place with a capital inflow.
The important difference in analysis is always the currency. Great bubbles unfold only when foreign capital is pouring into a domestic market. This is when the Japanese Nikkei Bubble took place in 1989 similar to 1929 in the States. The capital left the USA as the Plaza Accord was pronouncing they wanted the dollar down by 40% to help trade creating the 1987 Crash and a capital flight from the States. The swing in capital back to Japan looks like the brain wave of a real crazy person, but that resulted in the 1989 Japanese Bubble.
There is a risk of correction in the US Share Market after May. But this has nothing to do with the PE Ratio. We are looking at capital flows and that is the real key. The attempt by the Washington Post and New York Times to stir up a coup to oust Donald Trump will have far greater impact on the dollar and US assets than the PE Ratio, which is a very myopic domestic view.


