How Did Socrates do at the 1929 High?
QUESTION: You said Socrates has been back tested. What did it write technical the day of the high in 1929?
PO
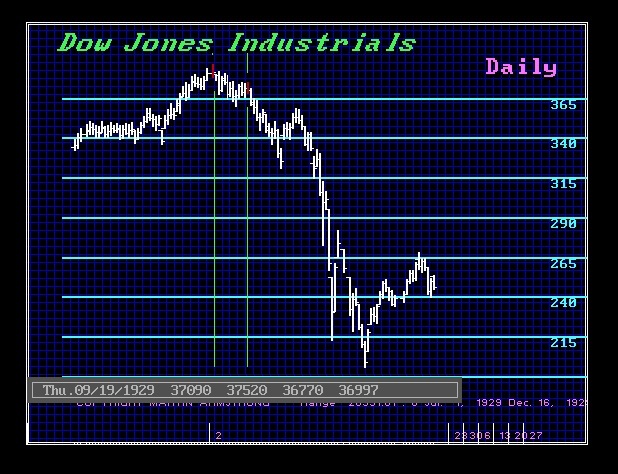
ANSWER: It has learned from all the data globally. Here is the technical analysis it wrote for 9/3/1929 without human editing:
The market scored a new major high on 09/03/1929 which is up 4 days from the last cyclical low. The broader rally has been over the past 17 days with a rise of 14%. This market has exceeded intraday 2 of three projected resistance points and it has closed below 2 others. Our underlying pivot providing some support lies at 37806. At the moment, the projected extreme resistance stands at 39120. Given the closing was weak, a lower opening followed by a break of this low of 37823 would warn that we may have an important temporary high in place as of this session.
The Uptrend Channel Resistance stands above the market at 39415 while the bottom of this Channel rests at 37966. Meanwhile, resistance provided by the top of this Channel will stand at 39648 for the next session.
The view from our Energy Models, the fact that the market is making new intraday highs in price and our Energy Models are declining, this warns of a divergence, which has been going on for the past day. Therefore, this immediate rally may prove to be unsustainable when such a divergence appears.
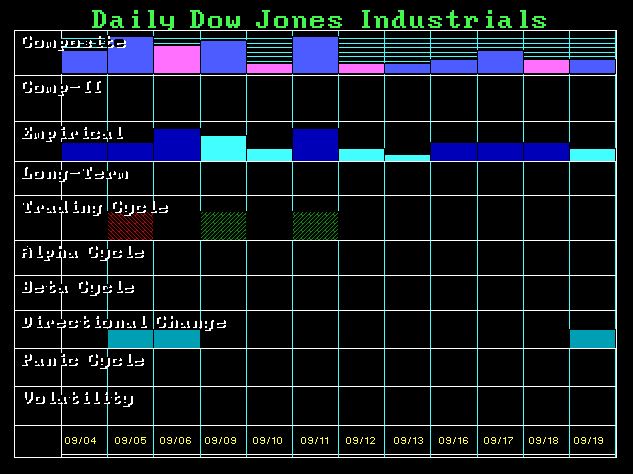
Here was the array. Note that it called for a 2-day correction into the 5th a bounce with a back to back Directional Change. There was a low on the 13th with a 4-day rally/consolidation and the 19th was the next Directional Change. The Panic then began on that Friday 20th. The Directional Changes are pretty good indicators.
Note: The Alpha cycles have been combined in the new arrays for display purposes. They were cycles only from high. The Beta Cycles were derived exclusively from lows.


