A Nose for Trading
QUESTION: I realize my opinion is of little consequence; but I find something interesting and needed to share. After doing a lot of backtesting using many criteria over many stocks my unqualified opinion is that no fixed criteria can be used analyze stock charts over time and many stocks.
I worked with a well respected radiologist in digital imaging. In the early days of digital imaging he perform studies on what resolution and how much time was required to accurately diagnosis a digital image. He told me it came down to a very experienced person would look at an image and get an “impression” of it and not so much looking for #1, #2… etc.
From 20 years of looking at many thousands of stock charts I understand this. As a human I will never be able to write a program that will capture all the nuances my mind will in an instant look at an image. I assume Socrates writes its’ own using an immense amount of data that continually changes. Maybe Socrates can write a program to diagnosis medical images – correct a lot of mistakes.
Bruce
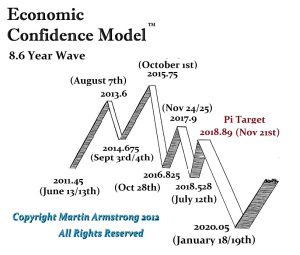
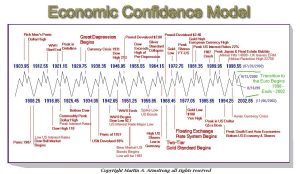
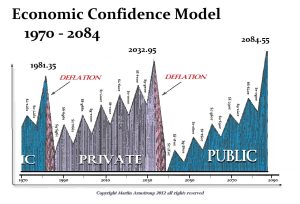
ANSWER: You are absolutely correct. We call it having a “nose” for trading. There is no single algorithm that you can devise or cycle that will predict every turn in a market. The reason for this is because such analysis is attempting to be employed in total isolation. Everything is connected. The Economic Confidence Model has called every turning point in the global economy, right down to the economic decline currently into January 2020.
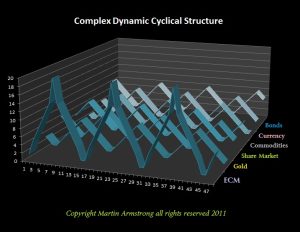
What you must understand is that this is a global business cycle and you must view it in that fashion. For each wave, the focus shifts. One wave will be a commodity is the hot investment. The next might be real estate, This may be followed by stocks or bonds. Then the focus will shift also around the globe so the “hot” market becomes Japan, then Southeast Asia, then Europe, then America.
Then there is the major trend insofar as the sentiment. We have all witnessed bullish news unfolds yet the market responds in a bearish mode. This is because there is also an oscillating trend to how we interpret events. Just recently, the Fed lowered rate at the top of the stock market in July 2019. The market crashed instead of rallying with lower rates. The interpretation suddenly shifted and people saw it as anticipation of an economic crisis to come.
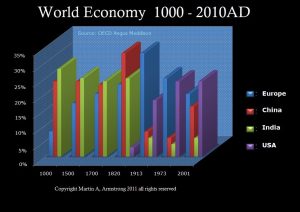
Nevertheless, the world economy turns with the cycle; some are making highs while others are makings lows. At the same time, we have the rise and fall of nations economically. This is why I say it cannot be forecast by looking at the trend of a single market in motion. While you can do technical analysis on any market, you should never lose track of the entire process. It is the global trend that will swamp a local market and a financial contagion will impact everything during a liquidity crisis. That is what happened in 1998 with the Long-Term Capital Management crisis. The problem was a loss in Russian bonds which could not be liquidated. To cover the losses, they began selling everything else to raise money. Even the Japanese yen rallied with the dollar falling from 147 to 103 in just weeks.
Global Market Watch: DJIND-D
Socrates is monitoring everything so it looks for things differently than a human analyst. Here is the Global Market Watch on the Dow Jones Industrials. It is entirely pattern-recognition. This is a different method of analysis altogether, demonstrating that a computer can have a “nose” for changes by studying the patterns in far more detail than a human. This allows Socrates to look just at the patterns and get that sixth-sense.
