Why are We All So Confused?
The three major distinctions in following what we do boils down to Multidimensional analysis merged with TIME and then PRICE. The Arrays give us a good sense of TIME where things come into the window of possibility. Understanding that we are dealing with TURNING POINTS and not specific events is critical. For example, the three major turning points we had in the Dow were November, January, and March. Under normal conditions, each should produce the opposite event of the previous. However, in VERTICAL MARKETS, one of the characteristics is the process of a cycle inversion whereby you exceed the November high and then you should rally into the next one instead of declining as just took place in the Dow currently. True, March could also invert and produce a high. That would be indicated by exceeding the January high and the failure to elect all four Daily Bearish Reversals.
Our price objectives are fairly easy to understand such as the 25000-28000 level on the Dow gave back on October 14th, 2014. Price targets become more important when the current trading activity reaches such a level in conjunction with the TIME targets.
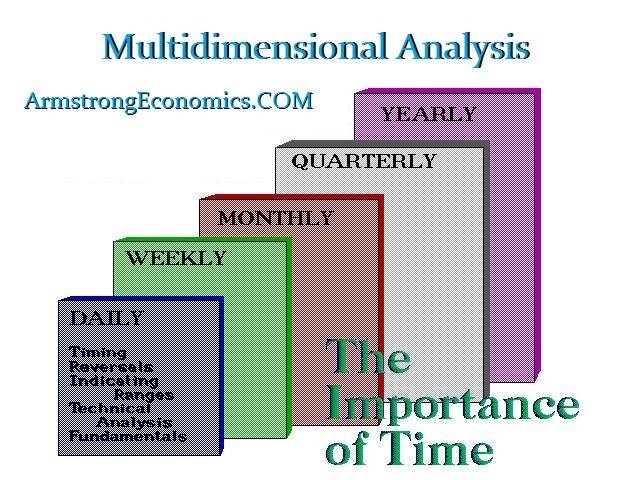
This brings us to the Multidimensional analysis. Virtually every model out there is a flat model. They attempt to forecast the future using typical a daily level of activity to generate buys and sells. These type of models can perform nicely when the market is trading in a normal pattern. The problem flat models introduce is the fact that they cannot forecast the big events because they cannot see them coming. To do that, we need a database and we need levels of TIME. Trend changes from a bull to a bear market only at the Monthly Level.
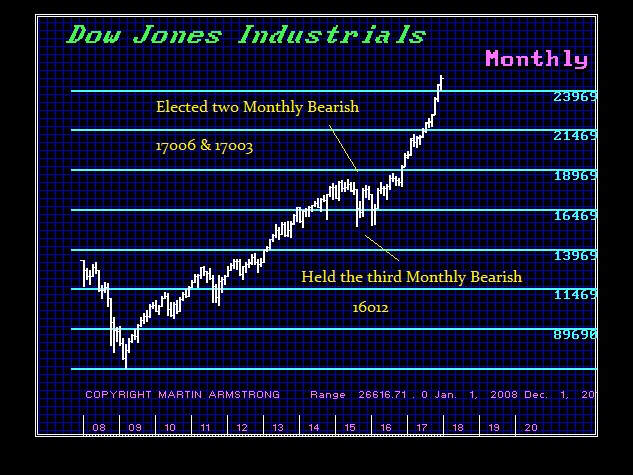
We can see that there were periods in the Dow that provided brief corrections. The challenge was to determine if those corrections change the trend. On our model, we can draw lines in the sand that if crossed provide the identification that the trend is actually changing. Trend is changed by electing all FOUR Monthly Bearish Reversals. What is typical is the fact that we elect the first two and hold the third. This is a strong correction which typically moves the majority to assume the trend has changed when it has not.
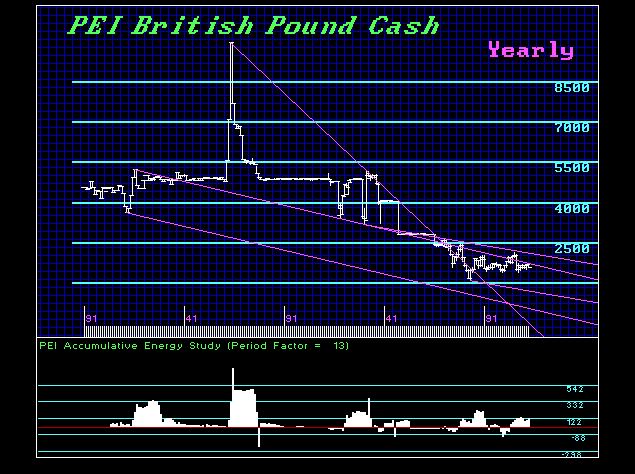
Here is the British pound back to the birth of the dollar. How can you even forecast BREXIT without a clear picture of the historical trend?


