Why Capital Flows Are the Only Real Guide to Market Trends
QUESTION: Hello Martin
I wish all the best for you. The work you make every day to rise up our understanding about the world is amazing and make me feel a huge respect. it is very inspiring. I’m a small customer of your private blog. I don’t know if you answer that kind of request.
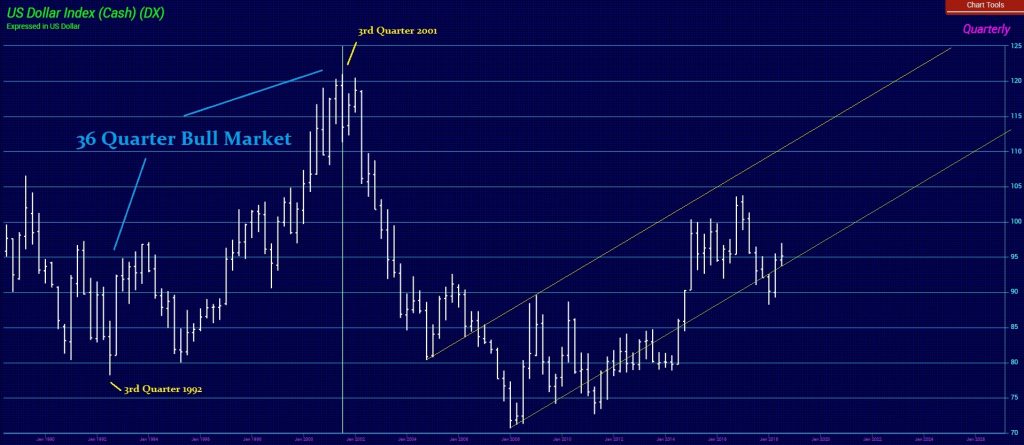
I want and I need to understand WHY the dxy was in bull market between march 2000 and feb 2002, from 102 to 113.
you are unbelievable when times come to understand economic history. I can’t find any explanation about this period
M2 supply decreased softly the twin deficit stood around 2% with no hope of getting better and it reversed after 2002 to 8% !!!
Interest rates were declining stock indexes were very bear from the tech turnmoil
Gold was bottoming from 420 to 380 with a reverse pattern during summer 2001. the dxy rise more than 3% after the bottom of gold in 1 year !
how could this DXY get up 10% higher in 2 years ??? what is the secret of history I miss ???? I believe there is something to learn with that period !
kind regards
CD
ANSWER: While the Euro began really in 1999, the physical notes did not come into circulation until 2000. The euro hit its all-time high shortly after its launch at the start of 1999 at that point in history which marked the euphoria of the talking heads on TV and how the Euro would crush the dollar. As always, they talked everyone into buying the high. As we say, buy the rumor and sell the news. That is an INCREDIBLY good market rule.
But The Euro began to slide thereafter, falling to a record low of 82.3 US cents in October 2000. However, both the euro and sterling then recovered at the lows when rumors began that an intervention by the European Central Bank and the Bank of Japan was imminent. In late afternoon trading that day, one euro bought 82.74 and one pound was worth $1.4329. They also spread rumors that Iraq would soon start to price its oil exports in euro and abandon the dollar.
The entire rally has absolutely NOTHING to do with the economic numbers in the United States. The capital inflows to the USA began over FEARS of the Euro. One major central bank was leaking inside info to us to get it out because we were NOT mainstream press and the info was going DIRECTLY to the real institutional money. They were deeply against the Euro because of the faulty design. It was a political creation that nobody in their right mind would have created such a currency under this structure. So the capital fled Europe and this was one of the reasons why the DOT.COM bubble was so big. It was aided by foreign capital fleeing Europe, to begin with.
The economic numbers are nice. But they are NEVER the entire story. Capital can flee one region because of events there and they may be going to a place that is not up to par, but still, it is the best alternative. Capital Flow Analysis which we developed is by far the only way to grasp the full extent of the economy.

