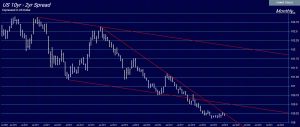
Inverted Yield Curve
The yield curve has been inverted for the last month. An inverted yield curve occurs when long-term government debt yields fall below rates on short-term notes and bills. For stock market investors, an inverted yield curve is typically a sign that equities could peak before an economic recession will follow. It also can be a precursor to a bear market in stocks, where equities fall 20% or more from highs which is the typical forecast. Some have pointed to the escalating China trade war. Investors, the claim, are worried that the China trade war and U.S. tariffs will slow global economic growth.
The 10-year Treasury note yield fell to 2.24% in early trading on May 29. Yields on three-month Treasury bills rose to 2.35%, well above the 10-year rate. The 10-year Treasury note fell below 2% on June 25 following the release of weaker-than-expected consumer confidence data. The three-month note traded at 2.13.%. Ten-year rates stood at 2.69% at the start of 2019. On June 4, 10-year Treasury notes slipped to 2.1 in midday trading, its lowest level in 20 months.
But much the real trend driving the inverted yield curve is capital inflows seeking long-term yields. Much of the capital has moved in from Europe. In addition, the amount of money in fixed-income exchange-traded funds passed $1 trillion last month, an ascendance that has reshaped the market in which countries and companies raise money to pay their bills. This has also altered the yield-curve. These forces have changed the dynamics of the marketplace and the traditional inverted yield curve does not necessarily mean what it once did and more than central banks use to be in control of the economy or money supply.

