Solar Minimum The Fastest Decline in almost 10,000 Years
QUESTION: Hi Marty !
Happy new year! Not written in a while, but wanted to ask a private question related to the forthcoming cold period.
a) How long will it last? (It will start now and go into 2024 – when does Socrates say it will start to reverse and when will temperatures be back to where they are now ?)
b) How far south does someone have to go who is allergic to cold anyway? Is it best to keep away from volcanic islands?
c) Is it in your view a minor cold blip or “OMG we’re all going to freeze to death and run out of food ?”
Just so I know the prognosis. It would be helpful if you could ask Socrates the relevant questions as I think there are a number of folks who would n’t mind knowing the answers to these types of questions – privately !!!
Trust all is well with you.
BR
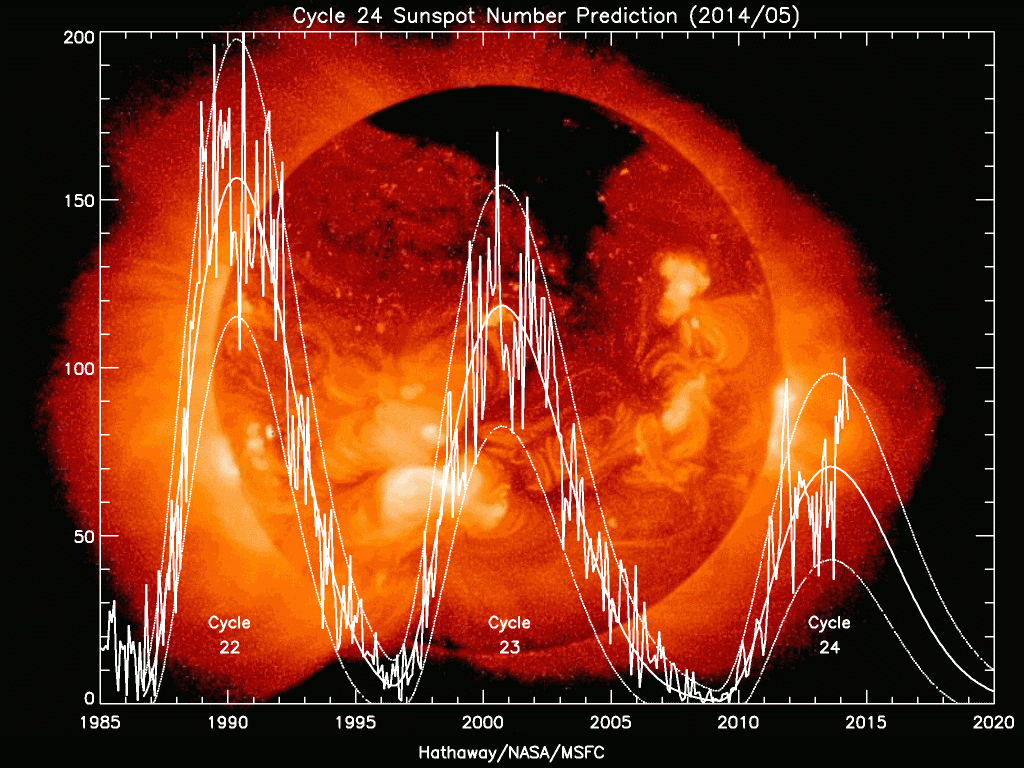
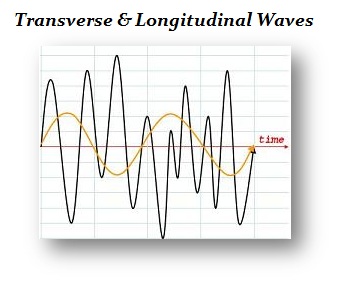
ANSWER: Socrates was projecting that the peak on this cycle aligned with the ECM 2015.75. This is a Longitudinal Cycle, not Transverse. That means peak to bottom varies. This wave should be a 13-year decline from 2015 making it 2028 at best. The outside projection calls for a 17-year decline and that lines up with the peak in the ECM 2032.
Worst still, the rate of decline will be brutal. This implies we are looking at the fastest decline in nearly 10,000 years. I suppose that is appropriate since we are also at a 5,000-year low in interest rates as well.
There is additional research correlating sunspot activity to planetary orbits. Real scientists are exploring climate change as a part of nature rather than man and the correlations are interesting. “The movement of planets, solar activity, and global climate change are increasingly being explored. The periodicity of
solar activity along with the physical mechanism of the changing of the Sun is an important topic in solar physics” (may 2017 Annales Geophysicae (EGU). Unlike the Global Warming crowd pushing fake research to get $1 billion grants from government welfare, real investigation into global climate change and solar activity is an incredibly vital and important subject in geophysics, which government is not funding with handouts because it does NOT support raising taxes.
There was a German astronomer, Samuel Heinrich Schwabe (1789–1875), founder of the sunspot theory, who discovered a regular cycle or variation in the number of sunspots occurring over a 17-year span (Schwabe 1843). There was the Russian professor A. L. Tchijevsky (also spelled Chizhevsky) (1897–1964), who initiated Schwabe’s sunspot theory and plotted an 11-year cycle back to the 5th century BC (Chizhevsky 1924).
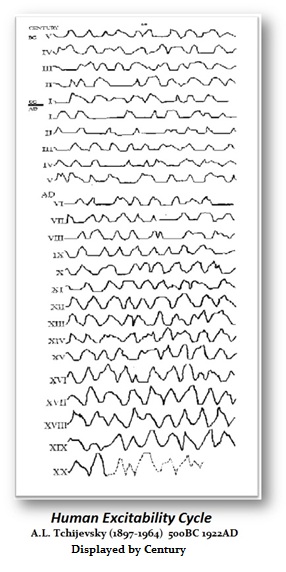 By 1900, the investigations into sunspots by the Russian scientist Tchijevsky began to explore the connections between solar variations, weather, and their impact on human activity. During World War I, Tchijevsky noticed between 1916 and 1917 (the period of peak sunspot activity and the solar explosions that followed) how these correlated with the war. He compared this with events in history to ascertain whether there was any connection. The historical database of 500 BC–1922 AD (a period of 2,422 years) that covered 72 countries was compiled (Tchijevsky 1938). He included in his compilations signs of human unrest and excitability such as wars, revolutions, riots, expeditions, and migrations.
Tchijevsky included additional factors, such as the number of humans involved, the quality of the event, and the size of the area affected. Additionally, he included the time when the unrest began, and its high point, which was reduced to arithmetical values of varying significance. With his volumes of data, Professor Tchijevsky constructed a year-by-year Index of Mass Human Excitability that covered the past 24 centuries in an amazing panorama of man’s emotional moods. After evaluating the most important events, Tchijevsky noticed that the most important human events had occurred during 80% of the maximum sunspot activity (Tchijevsky 1938).
The only problem with Tchijevsky’s work was still the one-dimensional thought process of trying to discover the single cause to the effect. The actual results are far more complex and dynamic. Yet Tchijevsky made a major contribution in investigating sunspots. Combining this data with ice core samples broadens the scope and now we begin to see climate take shape.
Additionally, we have to inject disease, plagues, and pandemics. When we add this data, we then begin to see it is the lack of sunspot activity that leads to disease, plagues, and pandemics. This, in turn, feeds migrations and was a leading cause of the invasion of Europe by the Huns. However, it was the Huns pushing West that drove the Goths to invade Rome.
Is the decline of the Roman Empire was in part also caused by climate change. Scientists have used tree rings to catalog the climate’s history. In fact, trees grow more during fertile years that result in thick tree rings. During dry years, trees rings grow far more narrowed and thus identify the climate cycle. Wood samples from sites throughout Europe collected from ancient Roman ruins have revealed that the Decline & Fall of the Roman Empire coincides with a period of unusually thin rings implying cold and dry periods.
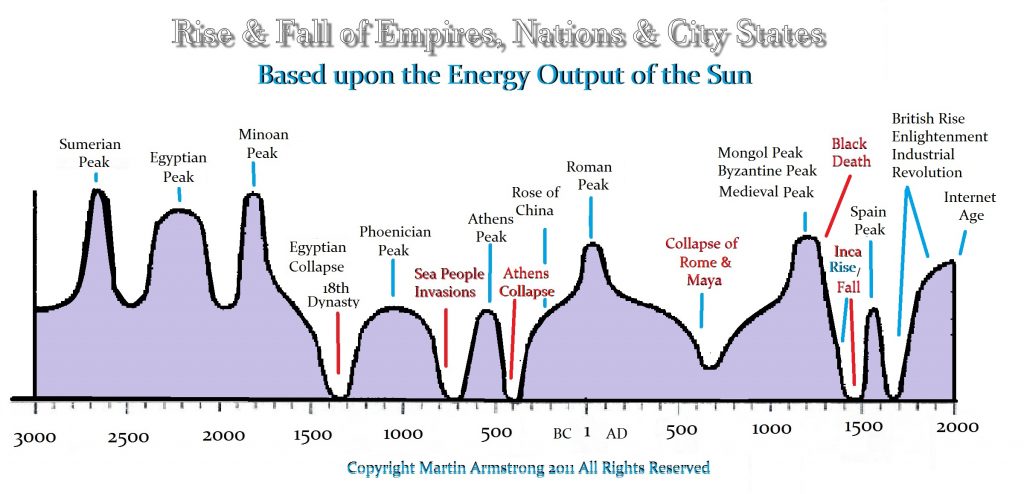
Correlating all the data from tree rings to ice cores and sunspot activity, what is clear is that society expands with Global Warming and collapses during Global Cooling. Voting for some political party (left or right) cannot change the climate. Politicians cannot even balance a budget, so they can play God?
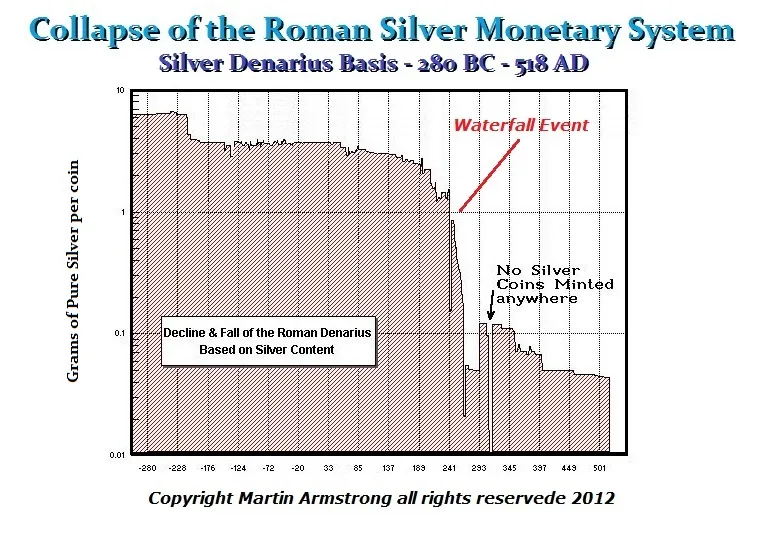
Wet and warm summers occurred during periods of every expansion of civilization be it Sumerian to the modern Internet Age. The decline in the energy output of the sun is lethal to civilization. This contributed to the Decline & Fall of the Roman Empire that was already economically weakened. The climate turned down from about 200AD and bottomed around 600AD.
The dry and cold period of the 3rd Century AD coincided with the economic decline of Rome, but it also provided the reason for the barbarian invasion. This led to the economic and political turmoil that resulted in the barbarians invading the northern provinces including Gaul. Once again, climate change was not the sole cause of the decline and fall. This contributed to the cause behind the barbarian invasions.
There were two major plagues that became pandemics during the Decline & Fall. There was one right following the top in about 180AD known as the Antonine Plague. But this was followed by Plague of Cyprian in the middle of the turbulent 3rd century and then the 6th-century Plague of Justinian, which may have finished the job. The ancient sources make the Plague of Justinian sound apocalyptic. The death toll in Constantinople was horrific died by the tens of thousands per day. The Emperor Justinian appointed a special officer, by the name of Theodore, in charge of coordinating the removal of corpses from the city’s streets. Theodore created mass graves with each pit filled with 70,000 corpses. We do know that archaeologists have assumed that mass mortality events go hand in hand with large, communal burials. The Justinian Plague appears to have resulted in a death toll of 35-55% of the population within just a few months during 555 AD quite similar to the Black Death of the 14th century.
Mass graves have been discovered concerning the Plague of Cyprian, in Egypt and Rome. The Plague of Cyprian (the Carthaginian bishop and eyewitness for whom the plague is named). Here the Plague began in Ethiopia around Easter of 250AD. It reached Rome in the following year by travel through trade and spread to Greece and then onto Syria. The plague lasted for about 20 years. At its peak, it was reported to have killed as many as 5,000 people per day in Rome.
Periods of drought, cold, floods, and famine exhausted the populations of the Roman Empire. St. Cyprian (200-258AD), bishop of Carthage, said at that time that it appeared as if the world was at an end.
There have been several protracted solar minimums since 1000 AD:
- Oort minimum (1040–1080 AD)
- Medieval Minor minimum (1150–1200 AD)
- Wolf minimum (1270–1350 AD)
- Spörer minimum (1430–1520 AD)
- Maunder minimum (1620–1710 AD)
- Dalton minimum (1787–1843)
This post-Dalton minimum peaked strangely with the Economic Confidence Model 1989.95. The peaks in solar activity have been declining with each wave subsequent to that turning point. It is now declining faster than ever previously know for nearly the last 10,000 years. So keep an extra supply of canned goods. They might come in handy.
