Market Talk – July 26, 2024
ASIA: The major Asian stock markets had a mixed day today: NIKKEI 225 decreased 202.10 points or -0.53% to 37,667.41 Shanghai increased 4.16 points or 0.14% to 2,890.90 Hang [...]

QUESTION: Hi Marty
I try not to bother you with questions, I know you’re plenty busy answering much more complex questions but I’m wondering if you could explain energy in the markets a bit?
I always watch for divergences in energy and price (both positive and negative), or fading energy during a rally, or a random jump in energy during a consolidation period but I can’t stop thinking about your last private blog where it can’t crash if the energy is negative… so only if it’s peaking? So should someone be cautious if the energy starts getting high? Does that also mean if it’s negative it has more potential to swing to the upside?
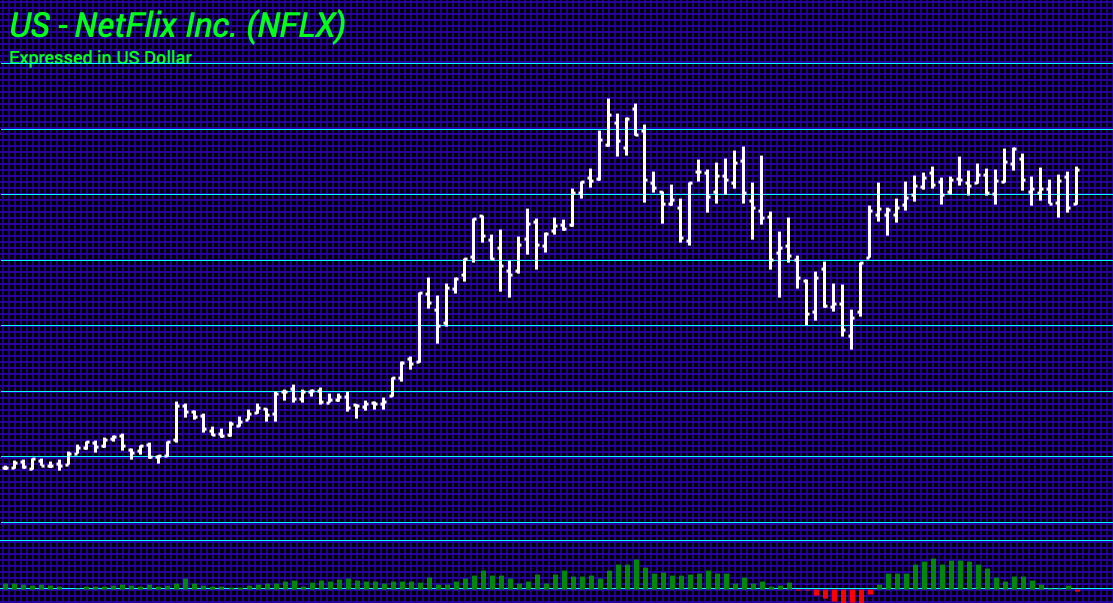
Here on bitcoin energy peaked after price peaked, which leaves me confused again, what does that mean? And both Bitcoin and Netflix and others I’ve found had a panic to the upside when the energy went negative, is this more of a rule, or are these exceptions?
And the million dollar question, are there other things I should be watching when it comes to energy? I’m sure there is still much I don’t know
Thank you,
NS
ANSWER: The Energy Model is measuring the bulls against the bears. It is providing a different measurement of how much “energy” remains in the market from the long-side. Therefore, if people are recently long, it shows to what extent that represents the whole of the market position. A crash is possible when energy is at a high level and a rally is likely when energy is negative.
In the case of Bitcoin, the market failed to make a new high with the new high in energy. That was the divergence warning that this was a top. In Netflix, the market was bottoming and the energy turned negative. Again, because the energy was negative, that effectively means the liquidation is over. It is impossible to get a panic crash without energy still in the positive. The risk will be to the upside when the energy is negative.
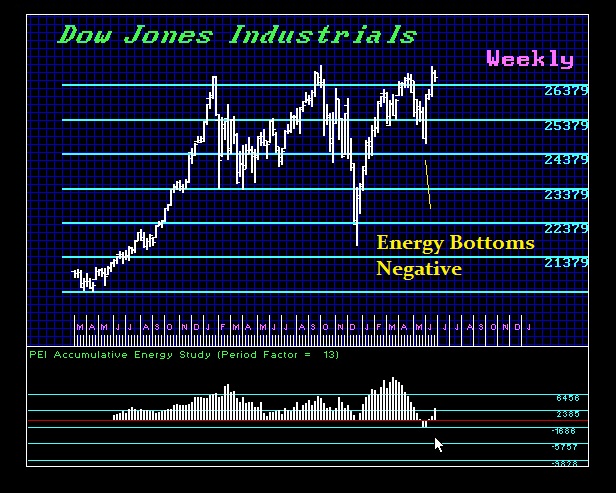
Now, let’s look at the Dow. You can see that energy bottomed negative three weeks before the breakout. This, again, warned there would be no crash as everyone was predicting. The Energy Indicator is an excellent tool in judging the risk in a market from a purely numerical perspective — not opinion.
